MITRE Challenge Graph
23 Feb 2011 #graph #matching #mitre #python #r
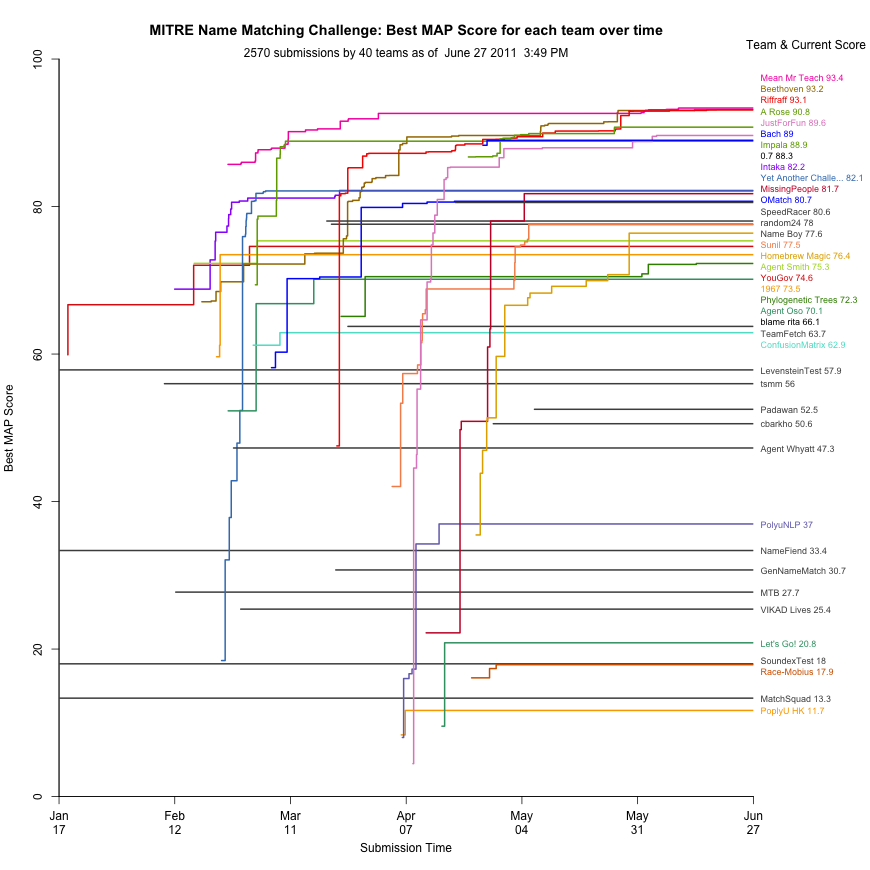
For my own curiosity I created a python + R script to grab the MITRE leaderboard and graph it. It’s a bit of python to grab the leaderboard and write out some CSVs. Then a bit of [R code][2] (updated link: http://a.libpa.st/4KFGq) generates the graph. It’s running automatically with launchd on my laptop, and it should be regularly uploading a png to the address below. Launchd is pretty awesome, but a royal pain in the ass to get set up. It doesn’t feel very deterministic.
I still need to figure out how to jitter the names so they don’t overlap (like YouGov & Agent Smith), but other than that I thought it was a nifty little exercise.

Each line is a team, with their best MAP scores as datapoints