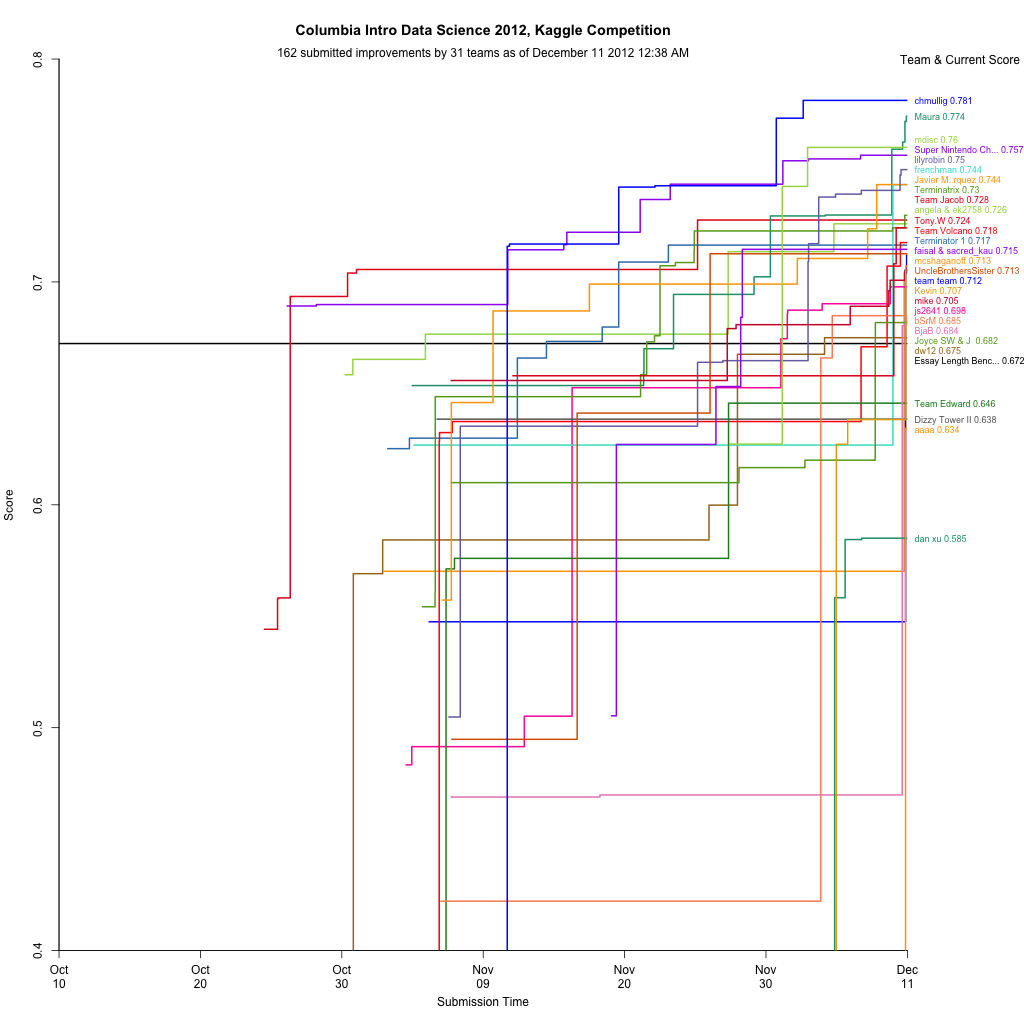
Intro to Data Science – Kaggle Leaderboard
07 Nov 2012 #Columbia #data science #graphing #kaggle #r
This semester I’m auditing Rachel Schutt’s Intro to Data Science class. I originally registered for it, but at the end of the add/drop period decided I wasn’t confident in my academic background, and wasn’t sure about the workload that would be required. In retrospect it was a mistake to drop it. However I have been attending class as I can (about half the time).
The final project, accounting for most of the grade, is a Kaggle competition. It’s based on an earlier competition, and the goal is to develop a model to grade standardized test essays (approximately middle school level). As an auditor Rachel asked me not to submit, but my cross-validation suggests my model (linear regressions with some neat NLP derived features) is still besting the public leaderboard (Quadratic Weighted Kappa Error Measure of .75), but who knows.
I thought I could easily adjust my MITRE competition leaderboard graph to Kaggle’s CSV, and it turned out to be pretty easy. The biggest issue ended up being that MITRE scored 0 to 100, and this scores 0 to 1. That had some unintended consequences. launchd + python + R should upload this every hour or so (when my laptop is running).
I’m frankly surprised Kaggle hasn’t done something like this before. Maybe if I have a bored evening I’ll try to do it in D3, which should look much nicer.
Update, 12/16: I’ve posted a followup after the end of the semester.
