Posted: December 16th, 2012 | Author: chmullig | Filed under: Nerdery, School | Tags: Columbia, data, data science, kagg, kaggle, python, r, statistics | 1 Comment »
The semester is over, so here’s a little update about the Intro to Data Science class (previous post).
Kaggle Final Project
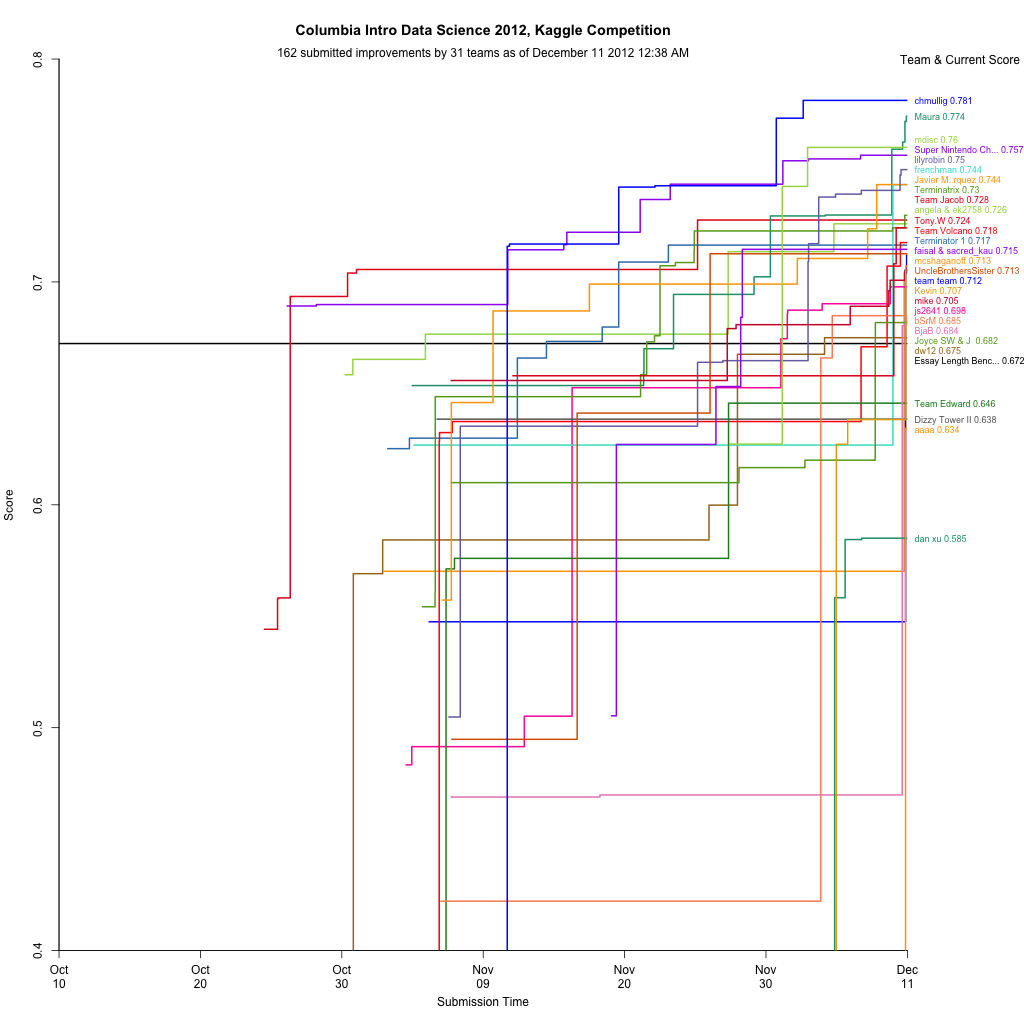
The final project was a Kaggle competition to predict standardized test essay grades. Although I still had lots of ideas, when I wrapped up a week early I was in first on the public leaderboard, and maintained that to the end. After it was over the private results gave first to Maura, who implemented some awesome ensembling. For commentary take a look at Rachel’s blog post. There’s a bit of discussion in the forum, including my write up of my code.
Visualization
During the competition I maintained a visualization of the leaderboard, which shows everyone’s best scores at that moment. Will Cukierski at Kaggle appreciated it, and apparently the collective impetus of Rachel and I encouraged them to make a competition out of visualizing the leaderboard! See Rachel’s blog post about it for some more info (and a nice write up about my mistakes).
Now back to studying for finals…
1 Comment »
Posted: April 27th, 2011 | Author: chmullig | Filed under: Uncategorized | Tags: damn lies, data, graphing, lies, presentation, statistics | 3 Comments »
Someone on twitter shared this article about the size of the big 4 ad agencies. Unfortunately it’s horribly, horribly flawed.
First, the numbers they’re presenting are wrong. I copied the headline numbers that they linked to into Excel (that file, with my graphs, is: here). Their top 4 category is right. The four largest do sum to $40.7 billion. However it appears that their “next 46″ is really numbers 3-50, #3 and #4 are being double counted in both categories. From what I can tell, the real number for the next 46 is $21.5 billion. Perhaps I’m not understanding something about the way these were computed, but that’s my understanding.
Finally, that graph is a travesty to data presentation. The y-axis range (starting at 32 instead of 0) obscures the data, and the cones are stupid beyond words.

Original Ad Age graph. Note the y-axis and stupid cones.
We can easily make that graph more useful by turning it into standard bars with a y-axis that begins at 0. Note that the difference appears much smaller, and more clearly.

My first revision - fixing the y-axis and using normal bars
Finally note that that’s actually a lie, because their summary doesn’t seem to line up with their data. Here’s how it would actually look, as far as I can tell.

This is using the totals I came up with based on their report
However ultimately I think this is a poor way of expressing the data. Top 4 is, to me, not that significant. I’d rather see how that tail actually plays out. Is it the top 10 that are pretty big, and then 11-50 are microscopic? Is it really just the top 1 that’s huge, and the rest are more even? A graph that shows each company separately would help a lot. So I made each company a bar, ordered them by rank, and highlighted the top 4 in red. To me this graph tells a much richer and more useful story. You can see that WPP and Omnicom are huge. Publicis and Interpublic are pretty large, but only half the first two. Then Dentsu, Aegis, Havas, and Hakuhodo DY are pretty big, around the 2-3 billion mark. Starting with Acxiom is falls off and is pretty consistent. Acxiom is half of Hakuhodo, but every company after is at least 84% of the one before it, with most around 95% of the next highest’s revenue.

Individually graphed agency holding companies. Top 4 highlighted in red. Notice the big changes in the top 9, then pretty consistent numbers.
Again if you’re interested you can check out the Excel file I slapped these numbers/graphs together in by downloading it here.
UPDATE: Matt Carmichael at Ad Age updated his post to something very much like my third. Tufte would be pleased.
3 Comments »
Posted: March 12th, 2011 | Author: chmullig | Filed under: Nerdery, politics | Tags: data, documentation, voter file | No Comments »
Political Data Nerds,
I’ve spent far, far too many hours of my life working with voter files. Every voter file sucks in its own unique way, and figuring out exactly how Montana sucks differently from Kansas is a unique and constant battle. Well, I’m tired of it! I don’t want to have to re-learn these challenges next time I work on a file, I don’t want to dig for the raw documentation (only to realize that it’s not always accurate).
I’m thinking of starting/contributing to a resource that consolidates documentation on all voter files out there. It wouldn’t be the data, it would just be freely available documentation to help anyone who’s already working with the data work with it more easily. What do you think?
I imagine it would have a list of vendors who provide these services as well, but the focus would be on helping anyone who’s trying to do it themselves. Probably should also have some more general tech recommendations, like how to concatenate files together, standardize addresses, geocode, etc.
Questions it would most definitely answer for every voter file (at least states, counties aren’t that important to me right now):
- Where can I request this, and how much does it cost?
- What format is it? CSV? Tab delimited text? Does it have a header? One file per county, or one per state?
- How is vote history stored?
- How do I translate from their geopolitical districts to something “standard?”
- How do I translate from their counties to county FIPS codes?
- What fields does it contain? Name? Address? Date of Birth? Phone? Party?
- Mapping their vote history to some more global standard (for the common elections).
This wouldn’t be doing anything for you, but hopefully it would ease the pain of anyone having to work with raw voter files.
Pew’s Data for Democracy report is an excellent start. However it’s a static and higher level document. I’d like a living document that contains more concrete information, and can be easily updated.
Does anyone know of an existing project doing this that I could contribute to? If not, are there any platforms better than Mediawiki to use? I’d rather not spend a lot of time writing original code for this, but that might be inevitable if I don’t want to do a ton of copy/pasting in mediawiki (boy does Mediawiki suck, too)…
No Comments »
Posted: March 12th, 2010 | Author: chmullig | Filed under: Nerdery | Tags: data, picloud, python | 2 Comments »
I had to crunch some data today, and decided to experiment a bit. It mostly involved lots and lots of Levenshtein ratios. On my laptop it took over 25 minutes to complete a single run (45k rows, several thousand calculations per row) – a bummer when you want to quickly iterate the rules, cutoffs, penalties, etc. First step was simply cutting out some work that was a nice-to-have. That got me down to 16 minutes.
Second was adding multiprocessing. I figured this would be easy, but the way I originally wrote the code (the function required both an element, and a penalty matrix) meant that just plain multiprocessing.Pool.map() wasn’t working. I wrapped it up with itertools.izip(iterator, itertools.repeat(matrix)), but that gives a tuple which you can’t easily export. It turns out that this, basically calculatorstar from the Pool example, is a godsend:
def wrapper(args):
    return func(*args)
So that got me down to 8 minutes on my laptop. However the cool part is that on an 8 core server I was down to only 1 minute, 30 seconds. Those are the sorts of iteration times I can deal with.
Then I decided to try the PiCloud. After trying it out earlier this week I thought it would be interesting to test it on a real problem that linearly scales with more cores. They advertise it in the docs, so I figured maybe it would be useful and even faster. Not so fast. It was easy to write after I already had multiprocessing working, but the first version literally crashed my laptop. I later figured out that the “naive” way to write it made it suck up all the RAM on the system. After less than 5 minutes I killed it with 1.7GB/2GB consumed. Running it on the aforementioned 8 core/32GB server had it consume 5GB before it finally crashed with a HTTP 500 error. I posted in the forums, got some advice, but still can’t get it working. (Read that short thread for the rest of the story). This seems like exactly what they should be nailing, but so far they’re coming up empty.
2 Comments »
