Posted: December 16th, 2012 | Author: chmullig | Filed under: Nerdery, School | Tags: Columbia, data, data science, kagg, kaggle, python, r, statistics | 1 Comment »
The semester is over, so here’s a little update about the Intro to Data Science class (previous post).
Kaggle Final Project
The final project was a Kaggle competition to predict standardized test essay grades. Although I still had lots of ideas, when I wrapped up a week early I was in first on the public leaderboard, and maintained that to the end. After it was over the private results gave first to Maura, who implemented some awesome ensembling. For commentary take a look at Rachel’s blog post. There’s a bit of discussion in the forum, including my write up of my code.
Visualization
During the competition I maintained a visualization of the leaderboard, which shows everyone’s best scores at that moment. Will Cukierski at Kaggle appreciated it, and apparently the collective impetus of Rachel and I encouraged them to make a competition out of visualizing the leaderboard! See Rachel’s blog post about it for some more info (and a nice write up about my mistakes).
Now back to studying for finals…
1 Comment »
Posted: November 7th, 2012 | Author: chmullig | Filed under: Nerdery, School | Tags: Columbia, data science, graphing, kaggle, r | 3 Comments »
This semester I’m auditing Rachel Schutt’s Intro to Data Science class. I originally registered for it, but at the end of the add/drop period decided I wasn’t confident in my academic background, and wasn’t sure about the workload that would be required. In retrospect it was a mistake to drop it. However I have been attending class as I can (about half the time).
The final project, accounting for most of the grade, is a Kaggle competition. It’s based on an earlier competition, and the goal is to develop a model to grade standardized test essays (approximately middle school level). As an auditor Rachel asked me not to submit, but my cross-validation suggests my model (linear regressions with some neat NLP derived features) is still besting the public leaderboard (Quadratic Weighted Kappa Error Measure of .75), but who knows.
I thought I could easily adjust my MITRE competition leaderboard graph to Kaggle’s CSV, and it turned out to be pretty easy. The biggest issue ended up being that MITRE scored 0 to 100, and this scores 0 to 1. That had some unintended consequences. launchd + python + R should upload this every hour or so (when my laptop is running).
I’m frankly surprised Kaggle hasn’t done something like this before. Maybe if I have a bored evening I’ll try to do it in D3, which should look much nicer.

Update, 12/16: I’ve posted a followup after the end of the semester.
3 Comments »
Posted: June 7th, 2012 | Author: chmullig | Filed under: Nerdery, School | Tags: birthday, programming, r, statistics | 17 Comments »
Andrew Gelman has posted twice about certains days being more or less common for births, and lamented the lack of a good, simple visualization showing all 366 days.
Well, I heard his call! My goal was simply a line graph that showed
Finding a decent public dataset proved surprisingly hard – very few people with large datasets seem willing to release full date of birth (at least for recent data). I considered voter files, but I think the data quality issues would be severe, and might present unknown bias. There’s some data from the CDC’s National Vital Statistics System, but it either only contains year and month, or isn’t available in an especially easy to use format. There’s some older data that seemed like the best bet, and which others have used before.
A bit more searching revealed that Google’s BigQuery coincidentally loads the NVSS data as one of their sample datasets. A quick query in their browser tool and export to CSV and I had the data I wanted. NVSS/google seems to include only the day of the month for 1/1/1969 through 12/31/1988. More recent data just includes year and month.
SELECT MONTH, DAY, SUM(record_weight)
FROM [publicdata:samples.natality]
WHERE DAY >= 1 AND DAY <= 31
GROUP BY MONTH, DAY
ORDER BY MONTH, DAY |
Some basic manipulation (including multiplying 2/29 by 4 per Gelman’s suggestion) and a bit of time to remember all of R’s fancy graphing features yielded this script and this graph:
See update at bottom!

I’ve labeled outliers > 2.3 standard deviations from the loess curve (which unfortunately I should really predict “wrapping” around New Years…), as well as Valentine’s and Halloween. You can see by far the largest peaks and valleys are July 4th, Christmas, and just before/after New Years while Valentine’s and Halloween barely register as blips.
It’s possible there data collection issues causing some of this – perhaps births that occurred on July 4th were recorded over the following few days? The whole thing is surprisingly less uniform than I expected.
Simulating Birthday Problem
I also wanted to simulate the birthday problem using these real values, instead of the basic assumption of 1/365th per day. In particular I DON’T multiply Feb 29th by 4, so it accurately reflects the distribution in a random population. This is data for 1969 to 1988, but I haven’t investigated whether there’s a day of week skew by selecting this specific interval as opposed to others, this is just the maximal range.
I did a basic simulation of 30,000 trials for each group size from 0 to 75. It works out very close to the synthetic/theoretical, as you can see in this graph (red is theoretical, black is real data). Of note, the real data seems to average about 0.15% more likely than the synthetic for groups of size 10-30 (the actual slope).

I’ve also uploaded a graph of the P(Match using Real) – P(Match using Synthetic).

If you’re curious about the raw results, here’s the most exciting part:
| n |
real |
synthetic |
diff |
| 10 |
11.59% |
11.41% |
0.18% |
| 11 |
14.08% |
14.10% |
-0.02% |
| 12 |
16.84% |
16.77% |
0.08% |
| 13 |
19.77% |
19.56% |
0.21% |
| 14 |
22.01% |
22.06% |
-0.05% |
| 15 |
25.74% |
25.17% |
0.57% |
| 16 |
28.24% |
27.99% |
0.25% |
| 17 |
31.81% |
31.71% |
0.10% |
| 18 |
34.75% |
33.76% |
0.98% |
| 19 |
37.89% |
37.90% |
-0.01% |
| 20 |
40.82% |
40.82% |
0.00% |
| 21 |
44.48% |
44.57% |
-0.09% |
| 22 |
47.92% |
47.45% |
0.47% |
| 23 |
50.94% |
50.80% |
0.14% |
| 24 |
53.89% |
53.79% |
0.10% |
| 25 |
57.07% |
56.76% |
0.31% |
| 26 |
59.74% |
59.75% |
-0.01% |
| 27 |
62.61% |
63.00% |
-0.40% |
| 28 |
65.88% |
65.26% |
0.63% |
| 29 |
68.18% |
67.85% |
0.32% |
| 30 |
70.32% |
70.49% |
-0.18% |
| 31 |
73.00% |
72.73% |
0.27% |
| 32 |
75.37% |
75.65% |
-0.28% |
| 33 |
77.59% |
77.63% |
-0.04% |
| 34 |
79.67% |
78.86% |
0.81% |
| 35 |
81.44% |
81.24% |
0.19% |
| 36 |
83.53% |
82.79% |
0.74% |
| 37 |
84.92% |
84.52% |
0.41% |
| 38 |
86.67% |
86.62% |
0.05% |
| 39 |
87.70% |
88.09% |
-0.39% |
| 40 |
89.07% |
88.88% |
0.19% |
| 41 |
90.16% |
90.48% |
-0.32% |
Update
Gelman commented on the graph and had some constructive feedback. I made a few cosmetic changes in response: rescaled so it’s relative to the mean, removing the trend line, and switching it to 14 months (tacking December onto the beginning, and January onto the end). Updated graph:

17 Comments »
Posted: January 18th, 2012 | Author: chmullig | Filed under: Nerdery, Philosophising, School | Tags: cognition, Columbia, facebook | No Comments »
I wrote this as an Op-Ed for the last progression of University Writing. Posted here to share.
A recent study found that 87% of US undergraduates are on Facebook for an average of 93 minutes daily. At 11 hours a week that’s nearly as long as many of us spend in class. If 12 hours of classroom time is supposed to not just teach us facts but also train us to become more complex thinkers why do we pretend that 11 hours of Facebook won’t have an affect, too? Facebook asks us to constantly sift through posts, skim, evaluate, and make microscopic comments. By using Facebook we are training our minds to condense all issues into easily “like”-able one-liners, rather than complex essays.
During finals last month many of us turned to Facebook to relieve stress. Many students, including myself, found that Facebook became not a limited relief valve but a means of procrastination. By the night before an exam we thought our only recourse was to block Facebook. Then, finally, our true academic selves would shine in blissful focus and productivity.
If only it was that easy. The distraction and inability to focus that led us to block Facebook wasn’t because we were using Facebook that night. It was the result of our brain adapting to excel at the Facebook friendly tasks we demanded of it, at the expense of less frequent tasks, such as deep reading. After so many hours on Facebook over so many months the Facebook way of shallow thinking was dominant. The focused contemplative mindset became a difficult to achieve anomaly. The night before a paper was due was simply too late to change anything. Even though we were offline we carried Facebook’s in our cognition.
Any new intellectual technology, including Facebook, encourages certain ways of thinking and discourages others. The invention of writing allowed humanity to easily store and retrieve information, a laborious process in oral cultures, and in turn led to an explosion of knowledge. However Socrates, in Plato’s Phaedrus, warns of the cognitive downside to writing by retelling the legend of king Thalmus, who, upon receiving the gift of writing from the god Theuth immediately questions the tradeoff it requires. Readers, Socrates says, will “be thought very knowledgeable when they are for the most part quite ignorant” because there was no oral instruction, and therefore, in his opinion, no deep learning. Writing fundamentally changed how we think. Today Facebook is changing it again. It encourages us to think in terms of connections, which may be advantageous in an increasingly interdisciplinary world, but it discourages deep reading, analysis, and debate. We must acknowledge these changes, and then adapt to them.
Facebook has many advantages, such as staying in touch with friends & family. However research, and common sense, suggest that large amounts of unfocused Facebook browsing damages our ability to concentrate, to understand complex ideas, and to develop our own ideas. Must we choose to either concede our thought patterns to Mark Zuckerberg, or abandon Facebook entirely? Neither is a great choice.
Instead of simply embracing or abandoning Facebook take the opportunity presented by the new semester to assess your use over the long run. What benefits does it provide you? How can you maximize those benefits, while reducing the costs? By becoming a conscientious user today, by finals at the end of the semester your brain will be better trained to focus and think richer thoughts.
Being deliberate about Facebook isn’t easy, but hopefully a few of these techniques, which helped me, will help you. Schedule a concentrated block of Facebook time rather than browsing whenever the urge strikes; this shifts Facebook into a hobby rather than a shameful timewasting habit. When you’re off Facebook, be off Facebook; avoid the siren call of a quick status post, “Studying sooooo hard at Butler!” Adjust your Facebook settings to reduce notification emails; it’s much harder to resist temptation when it thrusts itself into your inbox. Don’t use Facebook as a study break; it forces you into the skim-evaluate-quip mindset rather than read-analyze-write. Plus, just like potato chips, it’s awfully hard to limit it to “just 2 minutes.” Experiment with different ways to control your use, and see what works for you.
Facebook will one day be passé, but whatever replaces it will affect our cognition, just like speech, writing, email, and Facebook itself already have. By first understanding the medium, and then deliberately engaging with it, we can attempt to capture the benefits and avoid the harmful effects.
No Comments »
Posted: September 27th, 2011 | Author: chmullig | Filed under: School | Tags: Biking, Columbia, history, NYC | 1 Comment »
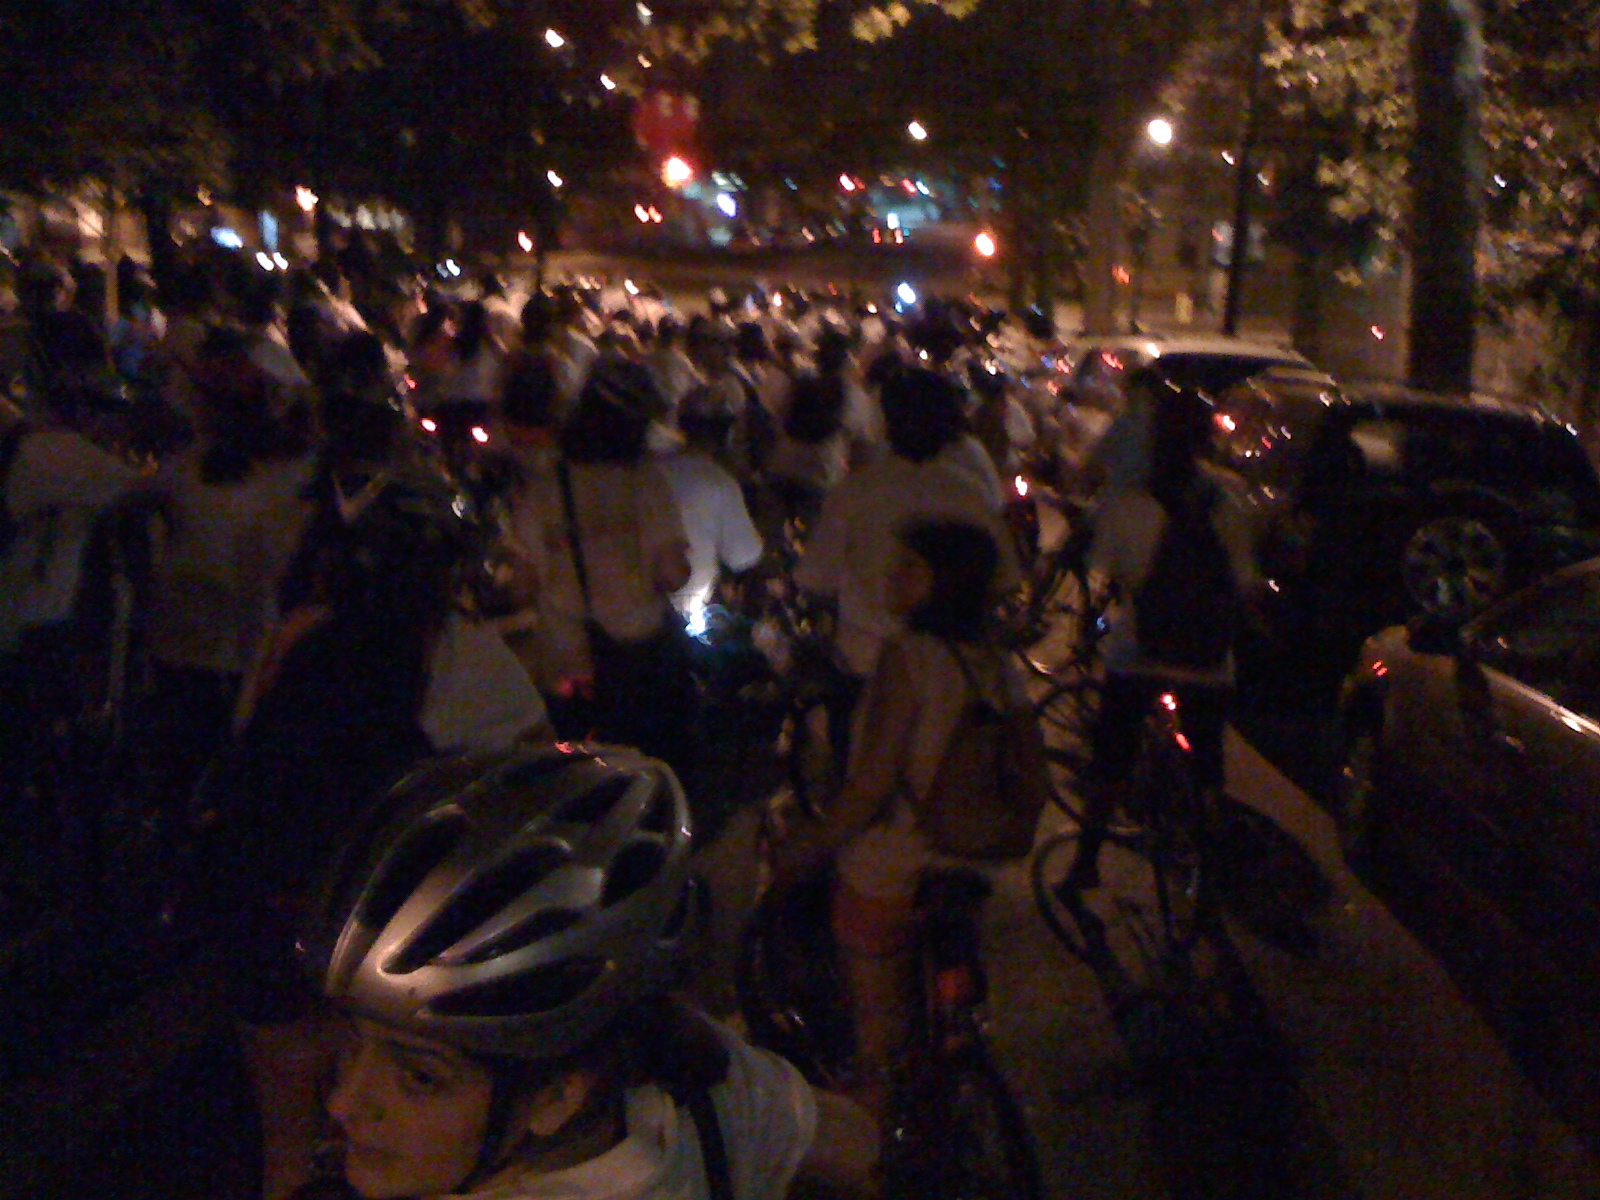
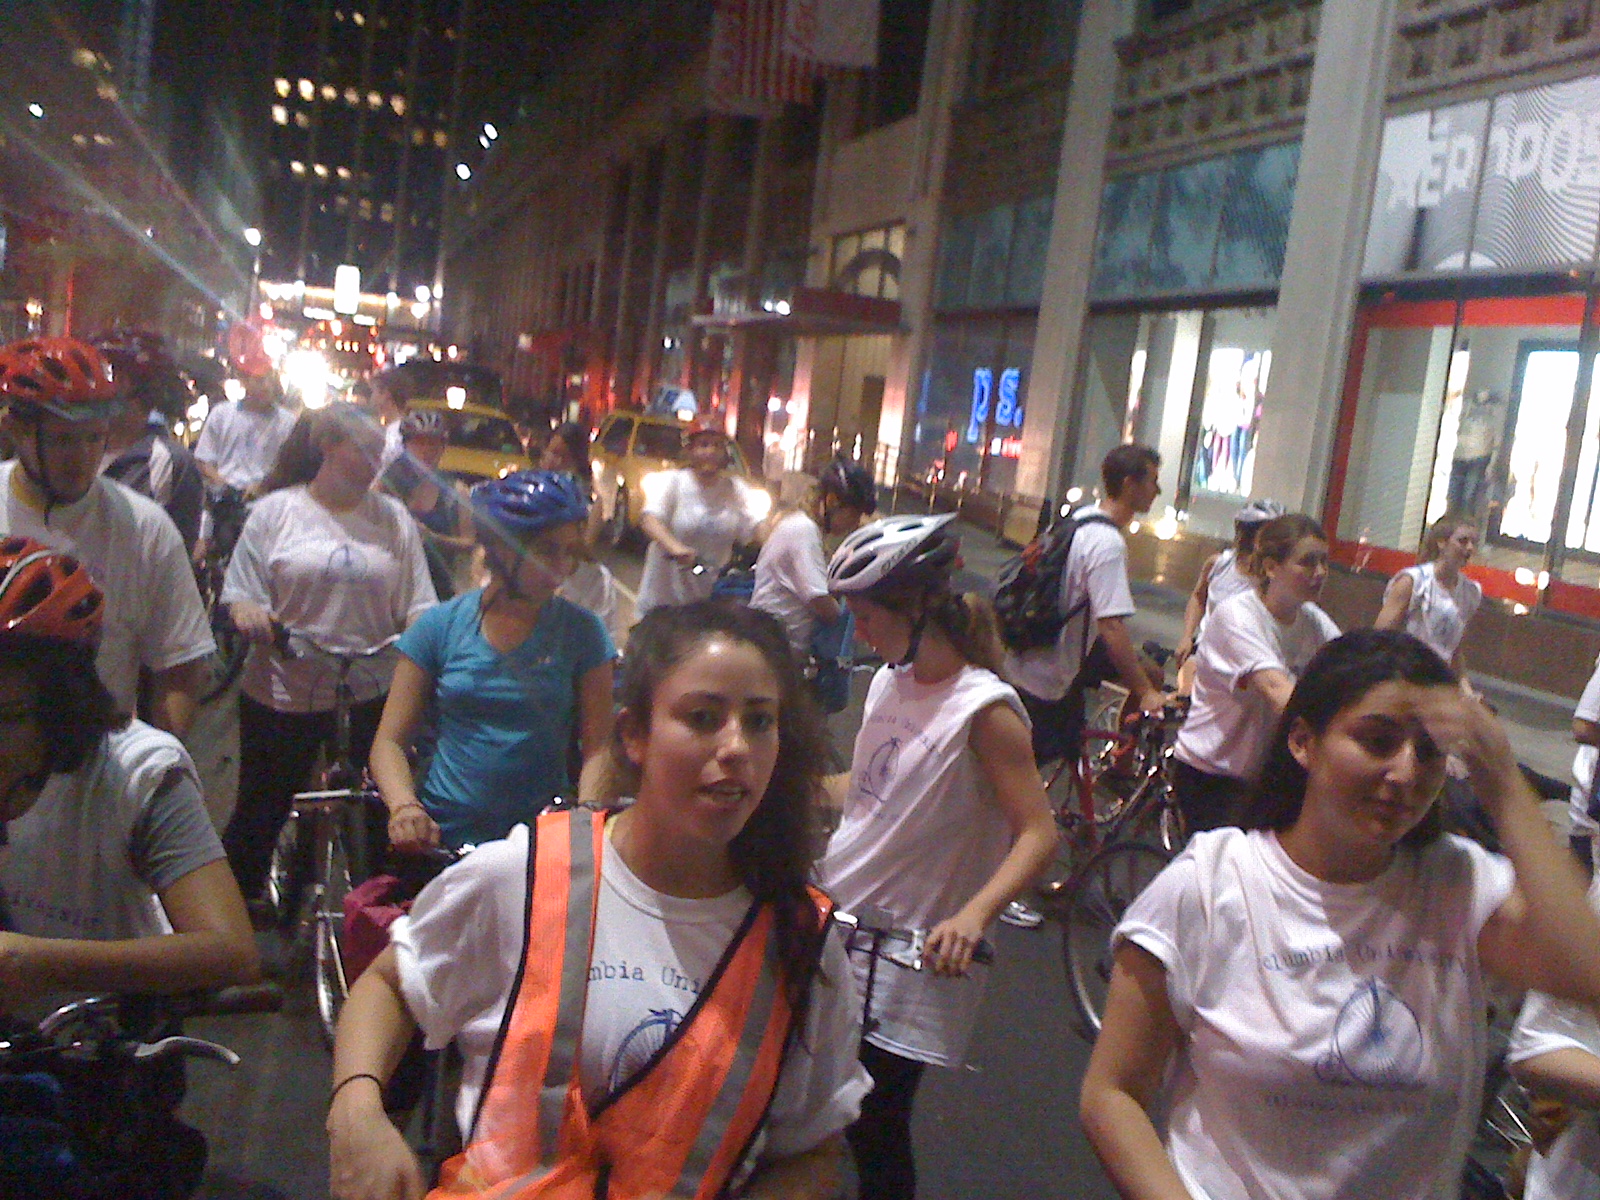
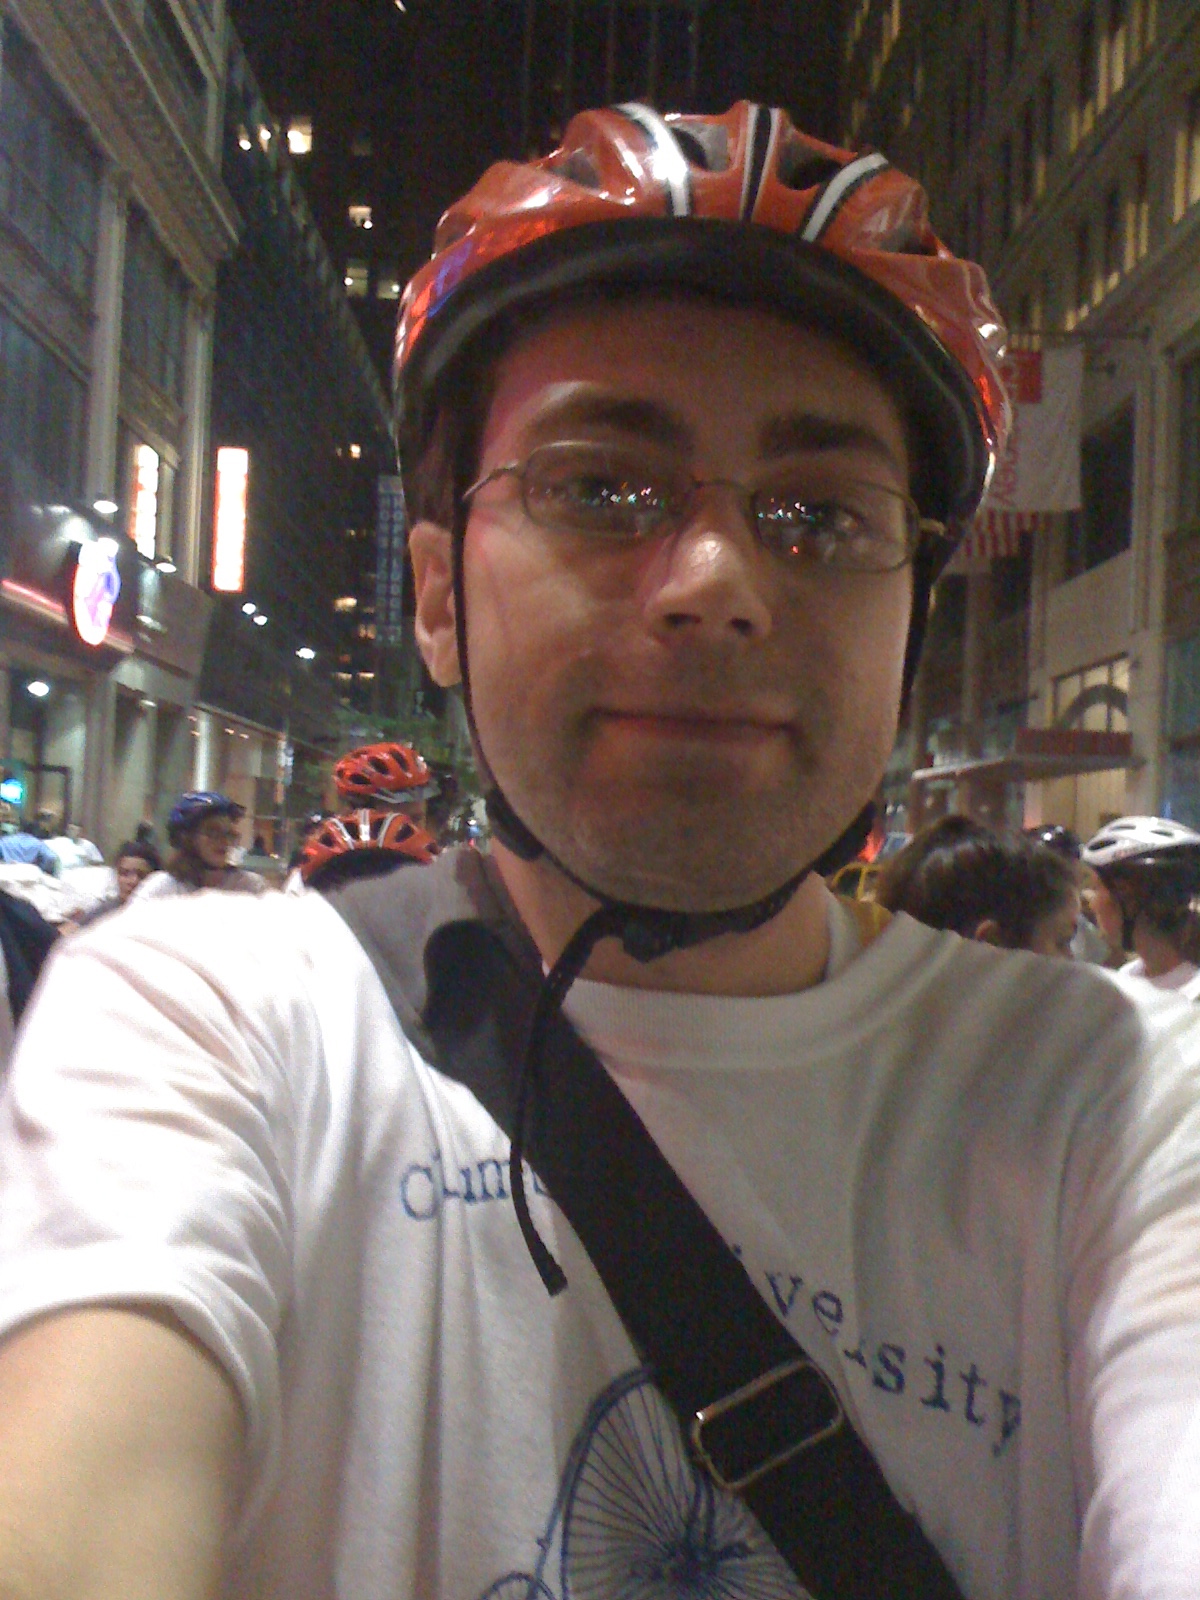
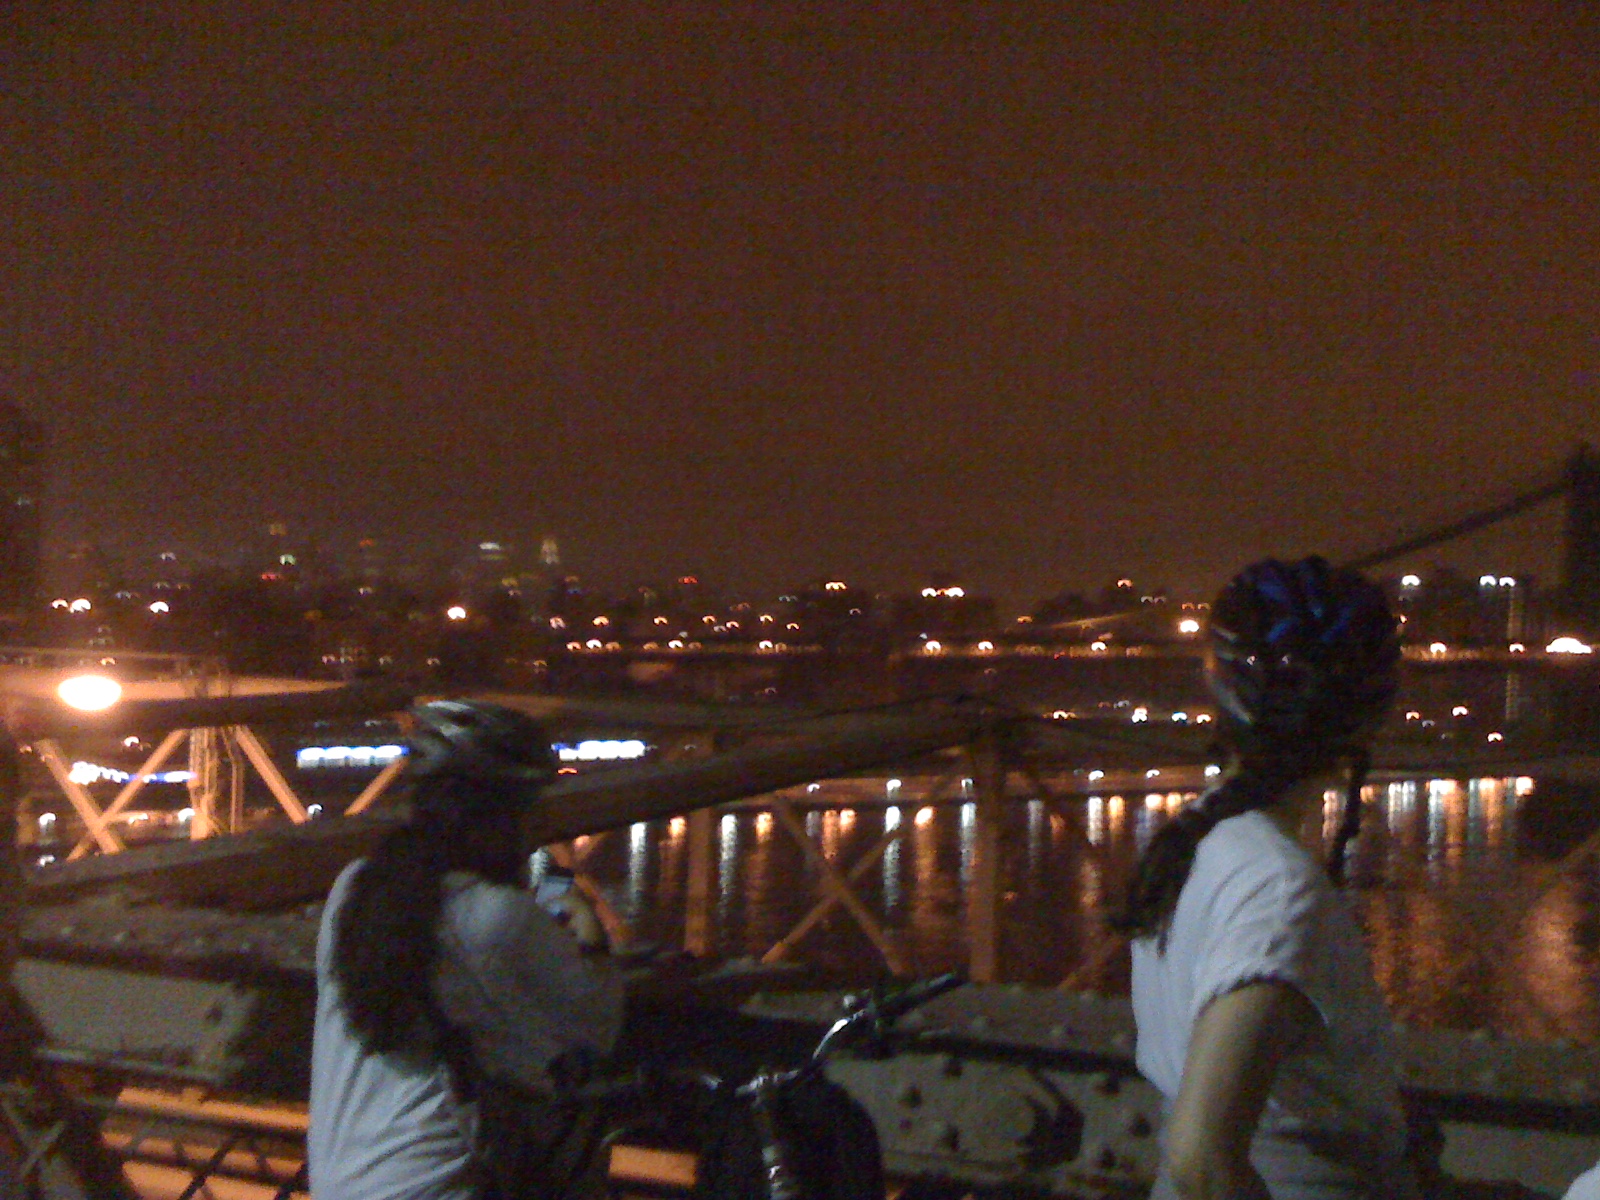
Last Thursday Night/Friday morning I participated in an all night NYC bike ride for one of my classes. For more official background, the WSJ wrote it up. It was an optional activity as part of the History of the City of New York class I’m taking with Kenneth Jackson at Columbia University. He, the class, and the bike ride are all institutions at the university, and I lucked into one of the ~400 spots in the class.
I’ve attempted to create a map of the route we took here, but it’s based on my recollection and certainly inaccurate on the details of exactly which streets we took. If anyone knows corrections, let me know. If I was thinking properly I would have taken my Garmin GPS!
It was really fun  I chugged a can of Illy espresso at 10:30, which helped a lot. Only getting ~3 hours of sleep the night before really didn’t help. Stupid University Writing draft.
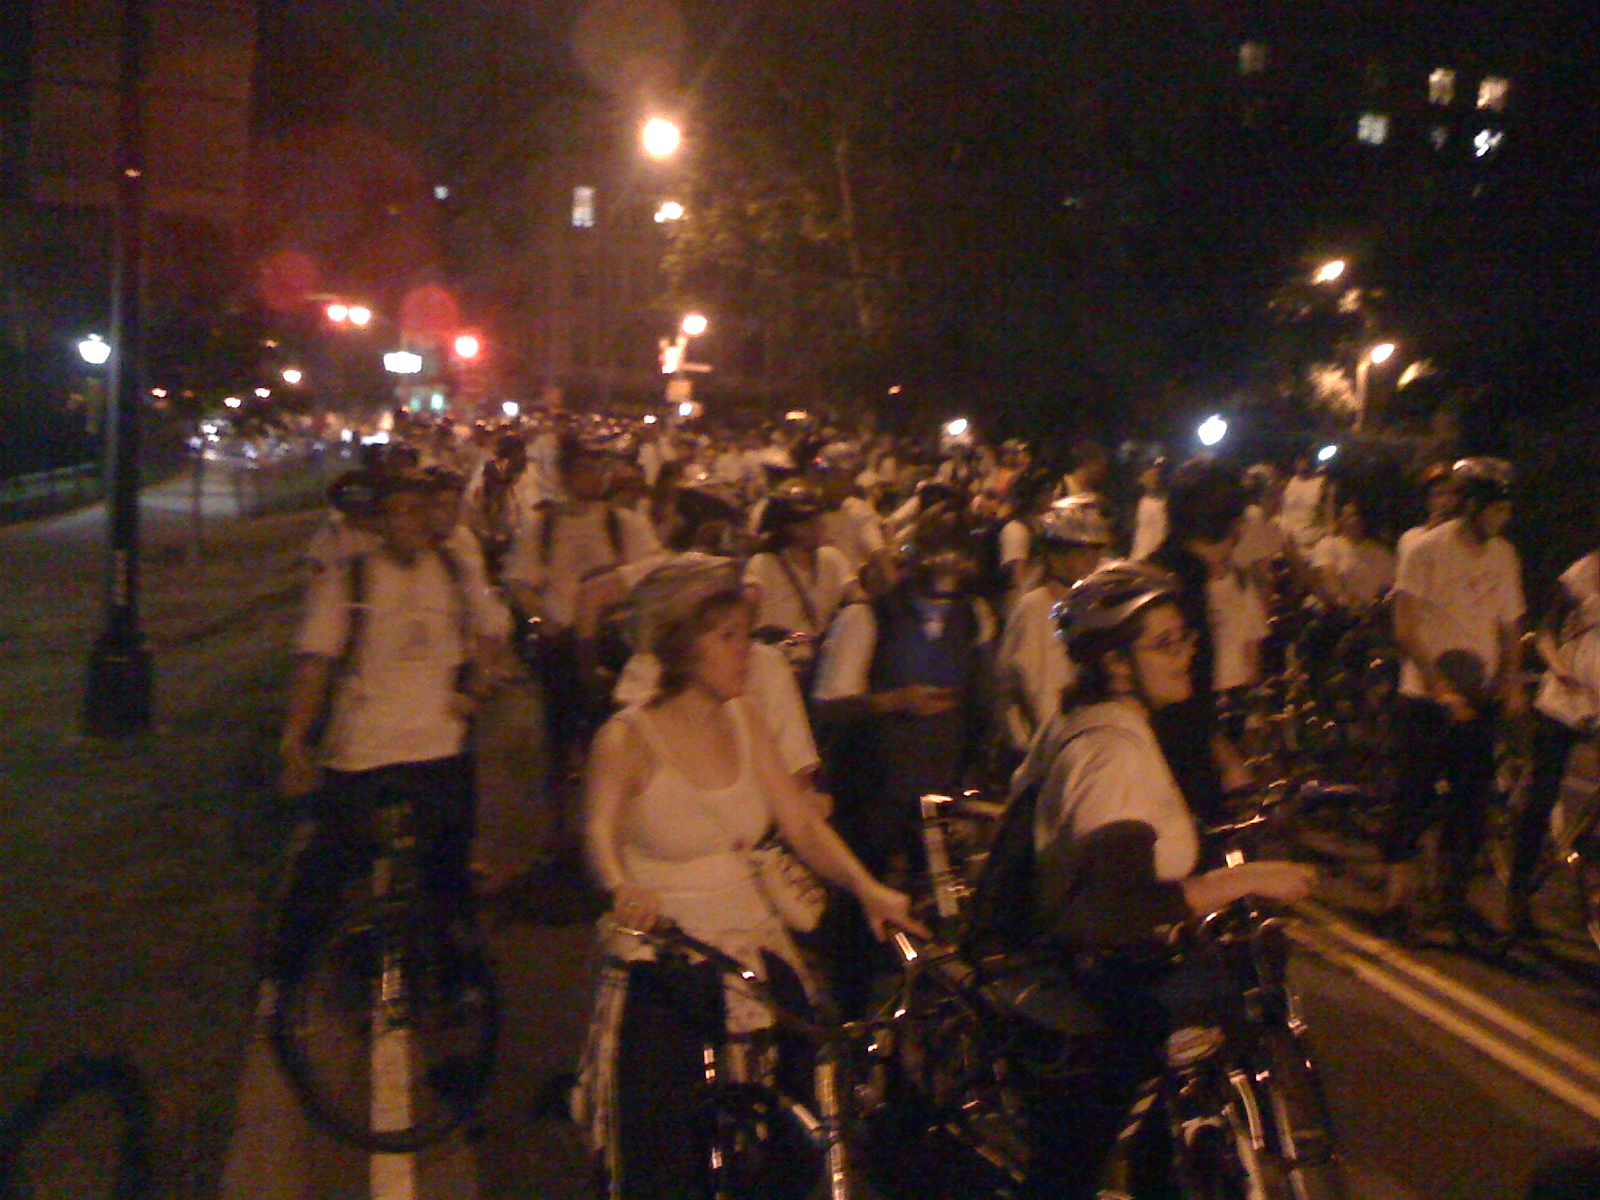
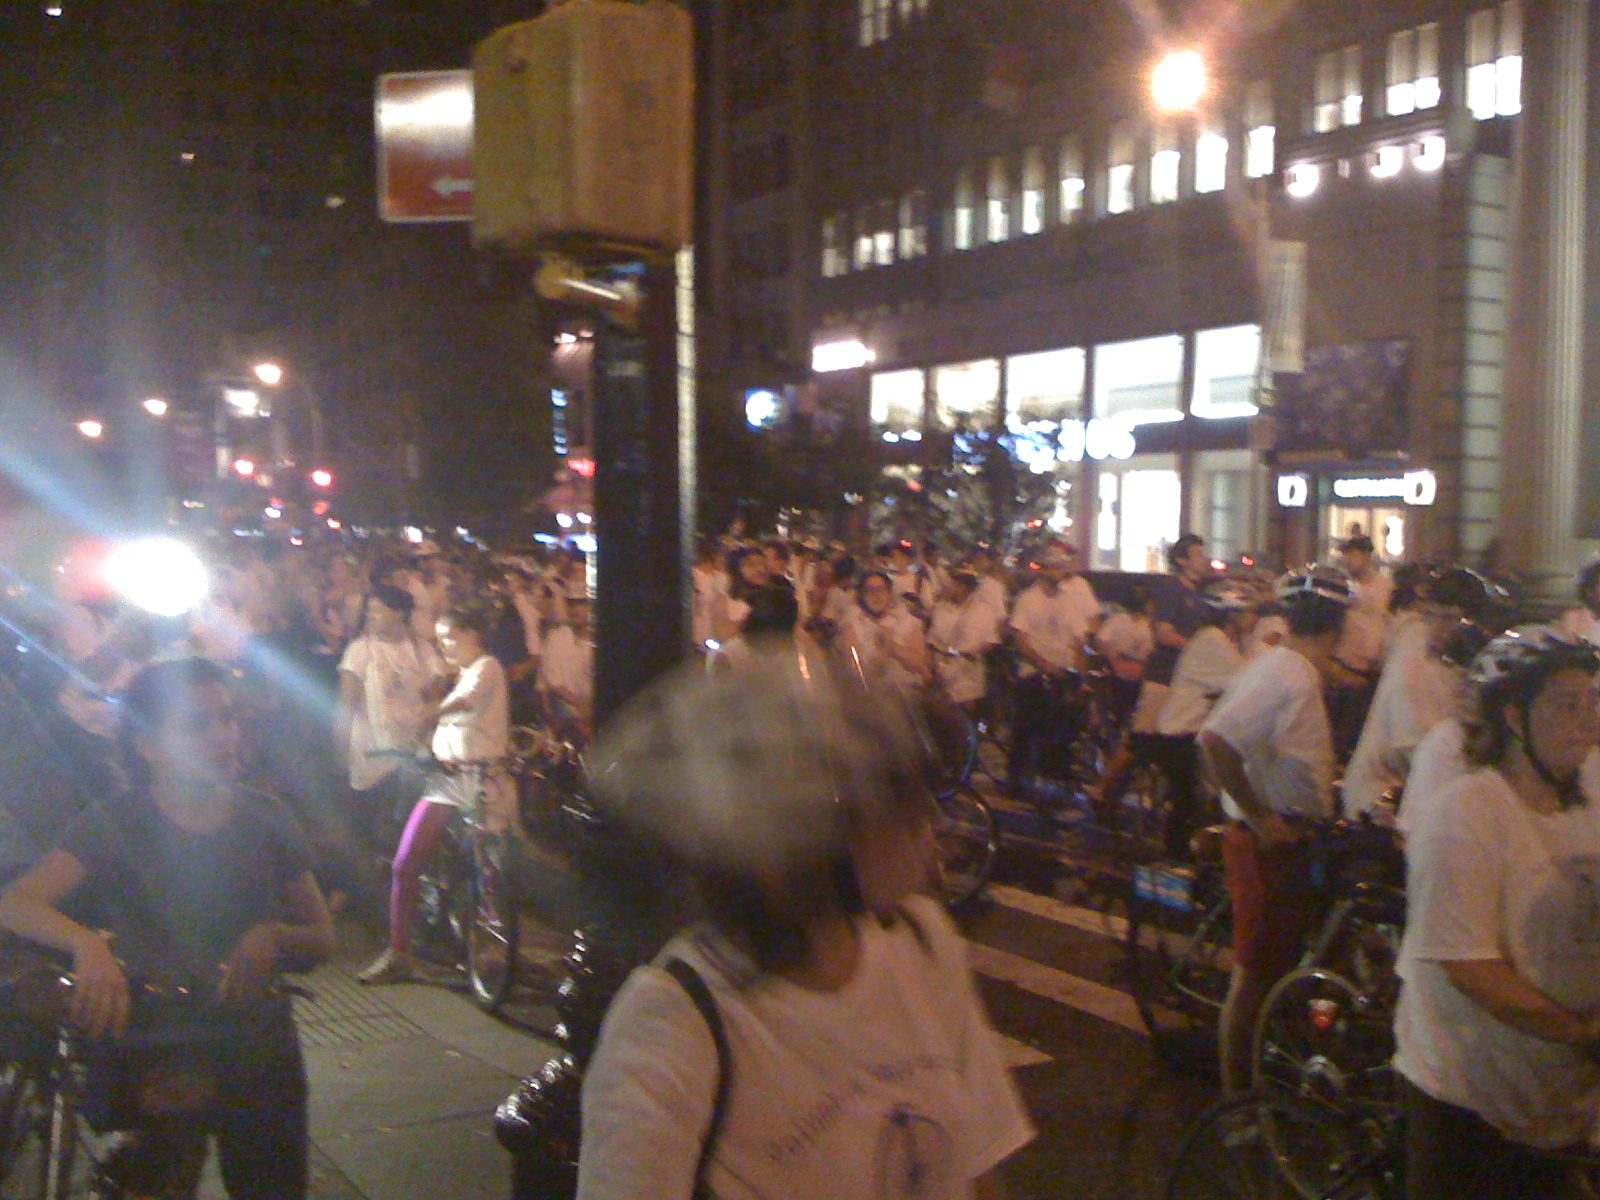
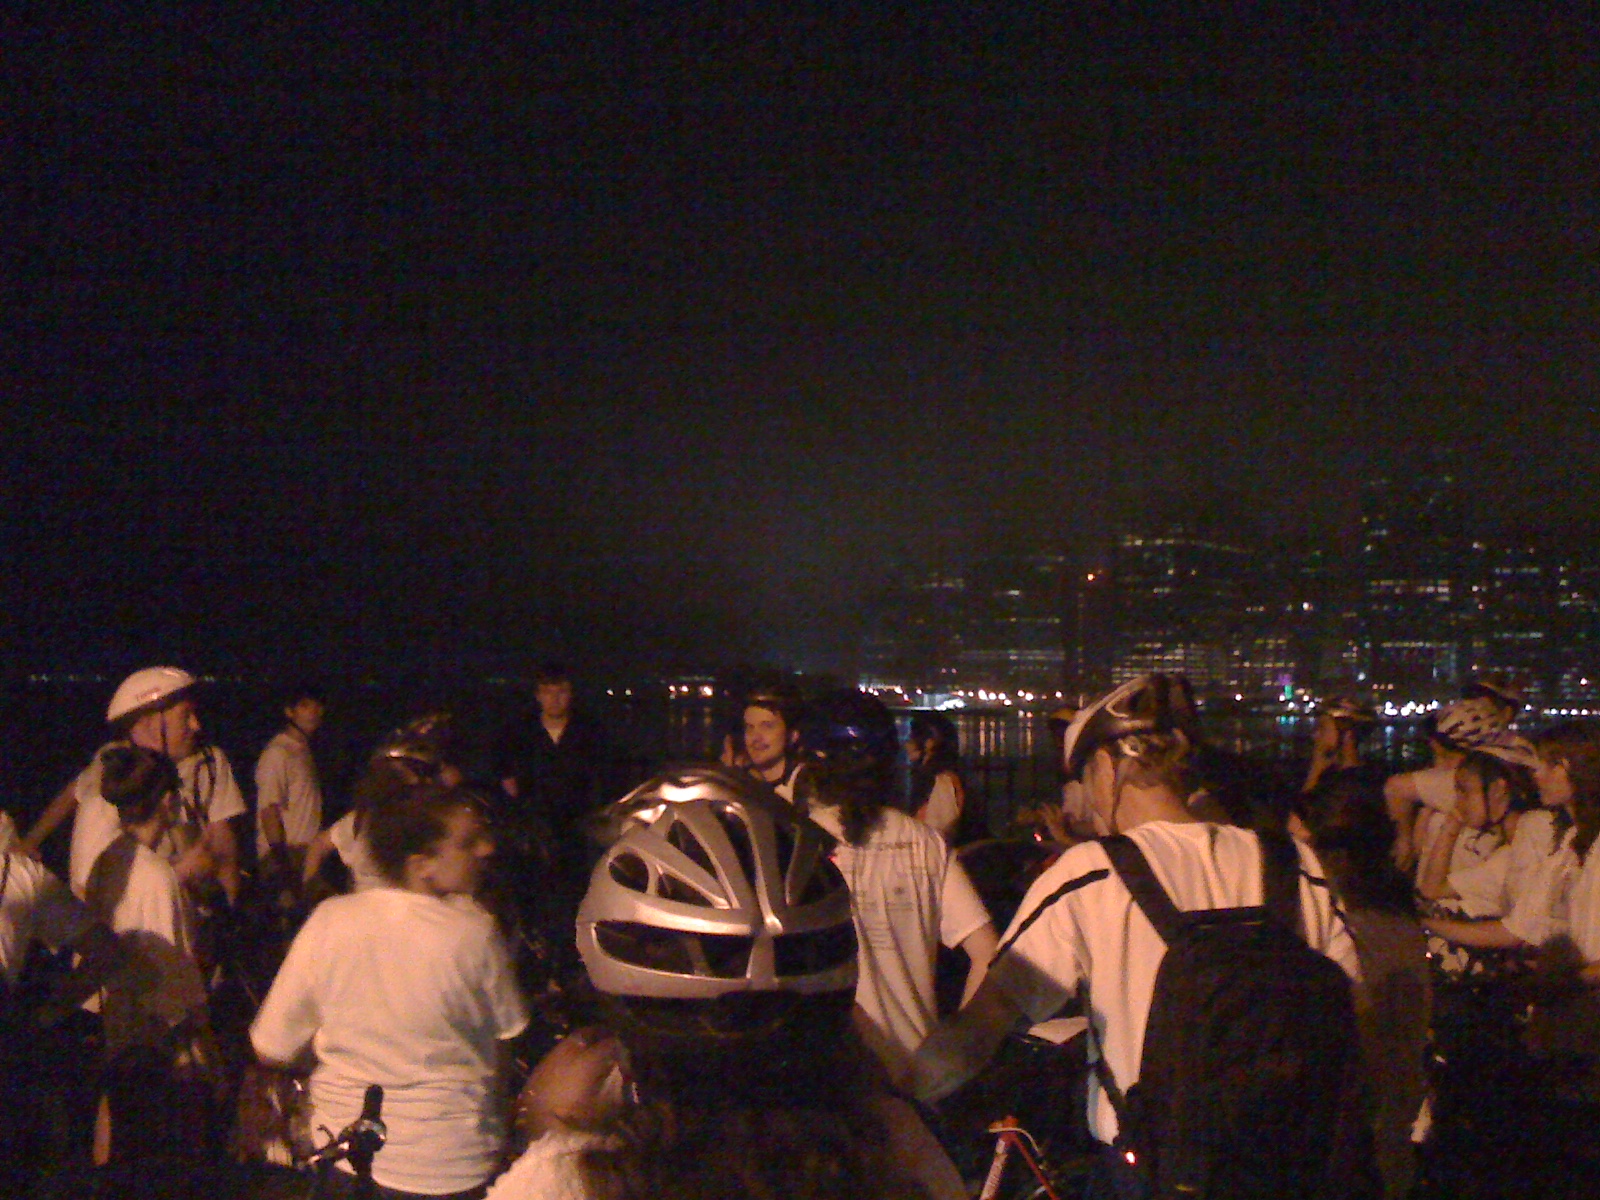
The whole class starting out at once on bikes was intense. Many of us were on rented and borrowed bikes and irregular bikers, so many weren’t very comfortable/confident. It’s really hard to bike slowly in general, especially in a crowd where you can’t turn much. The result was lots of weaving, dodging, and near misses. Plenty of minor bumps, but only a few people really fell down, and nobody needed serious assistance.
We pretty much just went and kept going, rarely did anyone, even the first people, stop for red lights. One of the Columbia Ambulances was bringing up the rear, flashing its lights the whole time. That came in really helpful in giving us some legitimacy, especially in midtown.
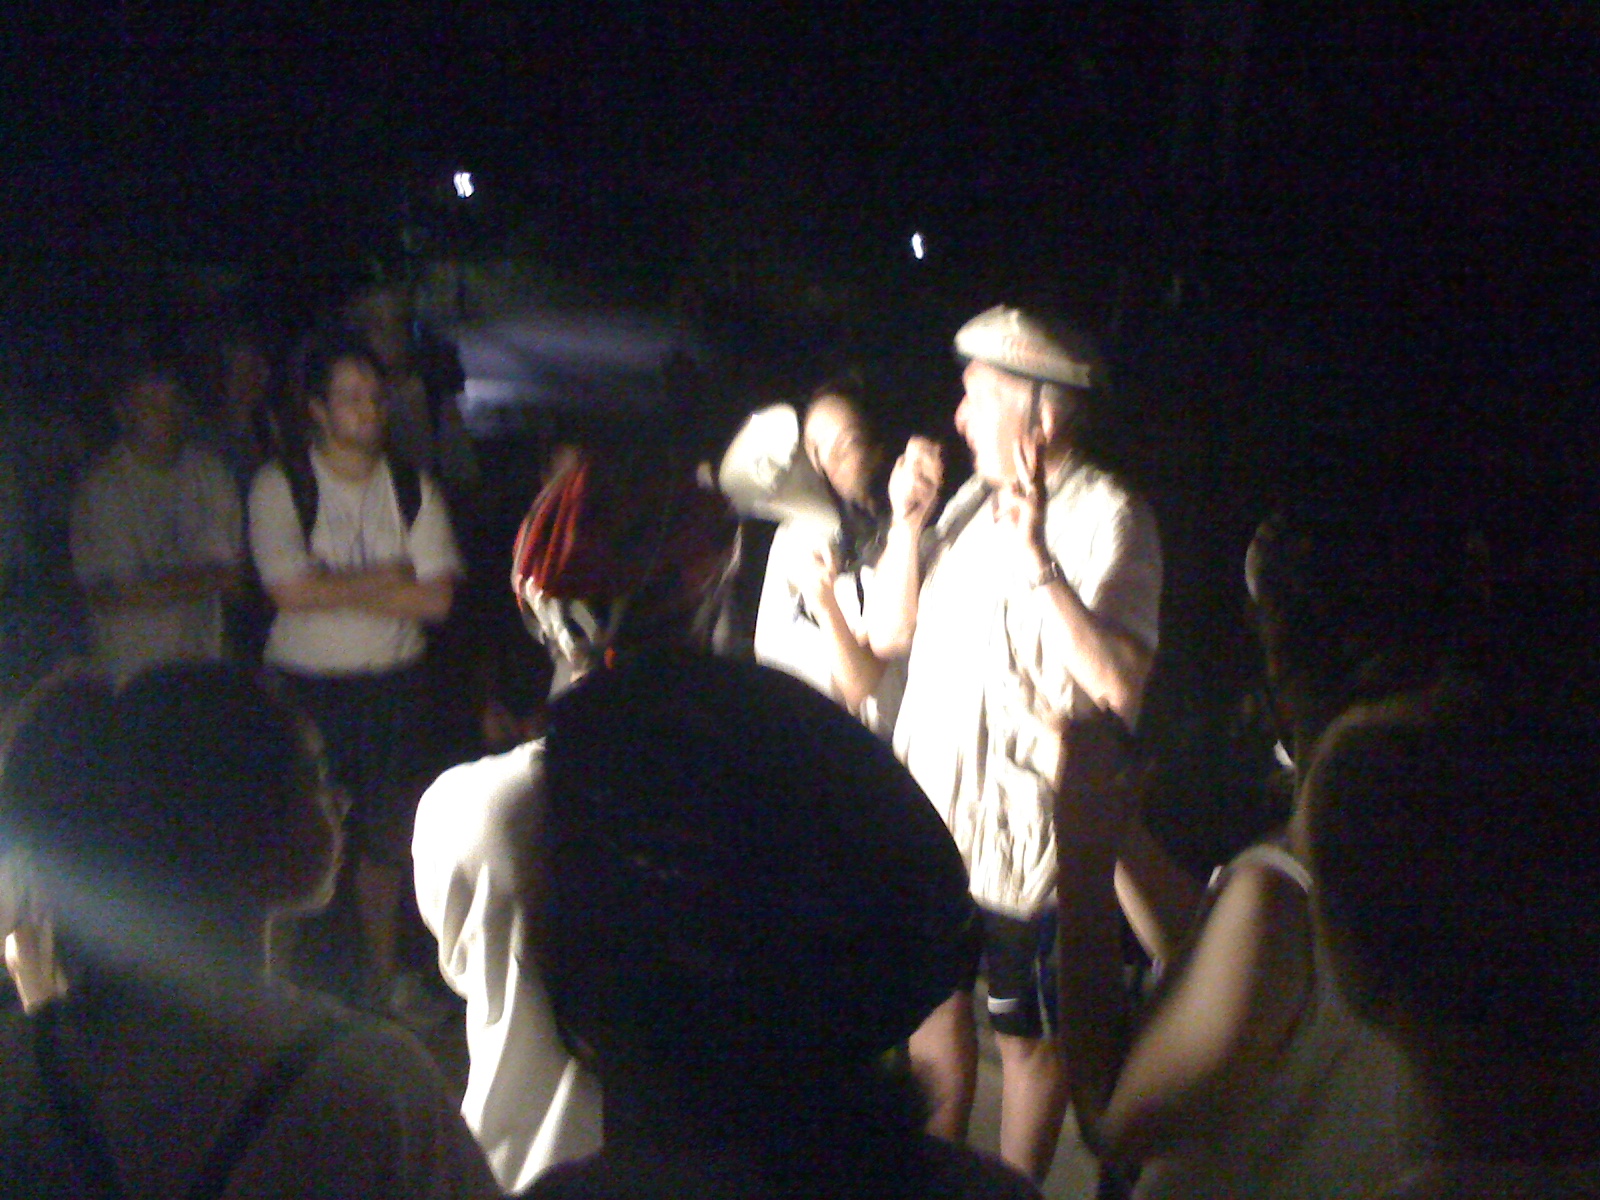
Around 1:30ish (I think…) we stopped at Washington Square Park (location of NYU, our wanna be rivals downtown). I went off in search of some food, and ended up having tacos from a cart, and then beer with several grad students, including the TA for my discussion section. A part of the group (1/3rd?) turned back at this point, hopping on the subway or taking cabs back uptown.
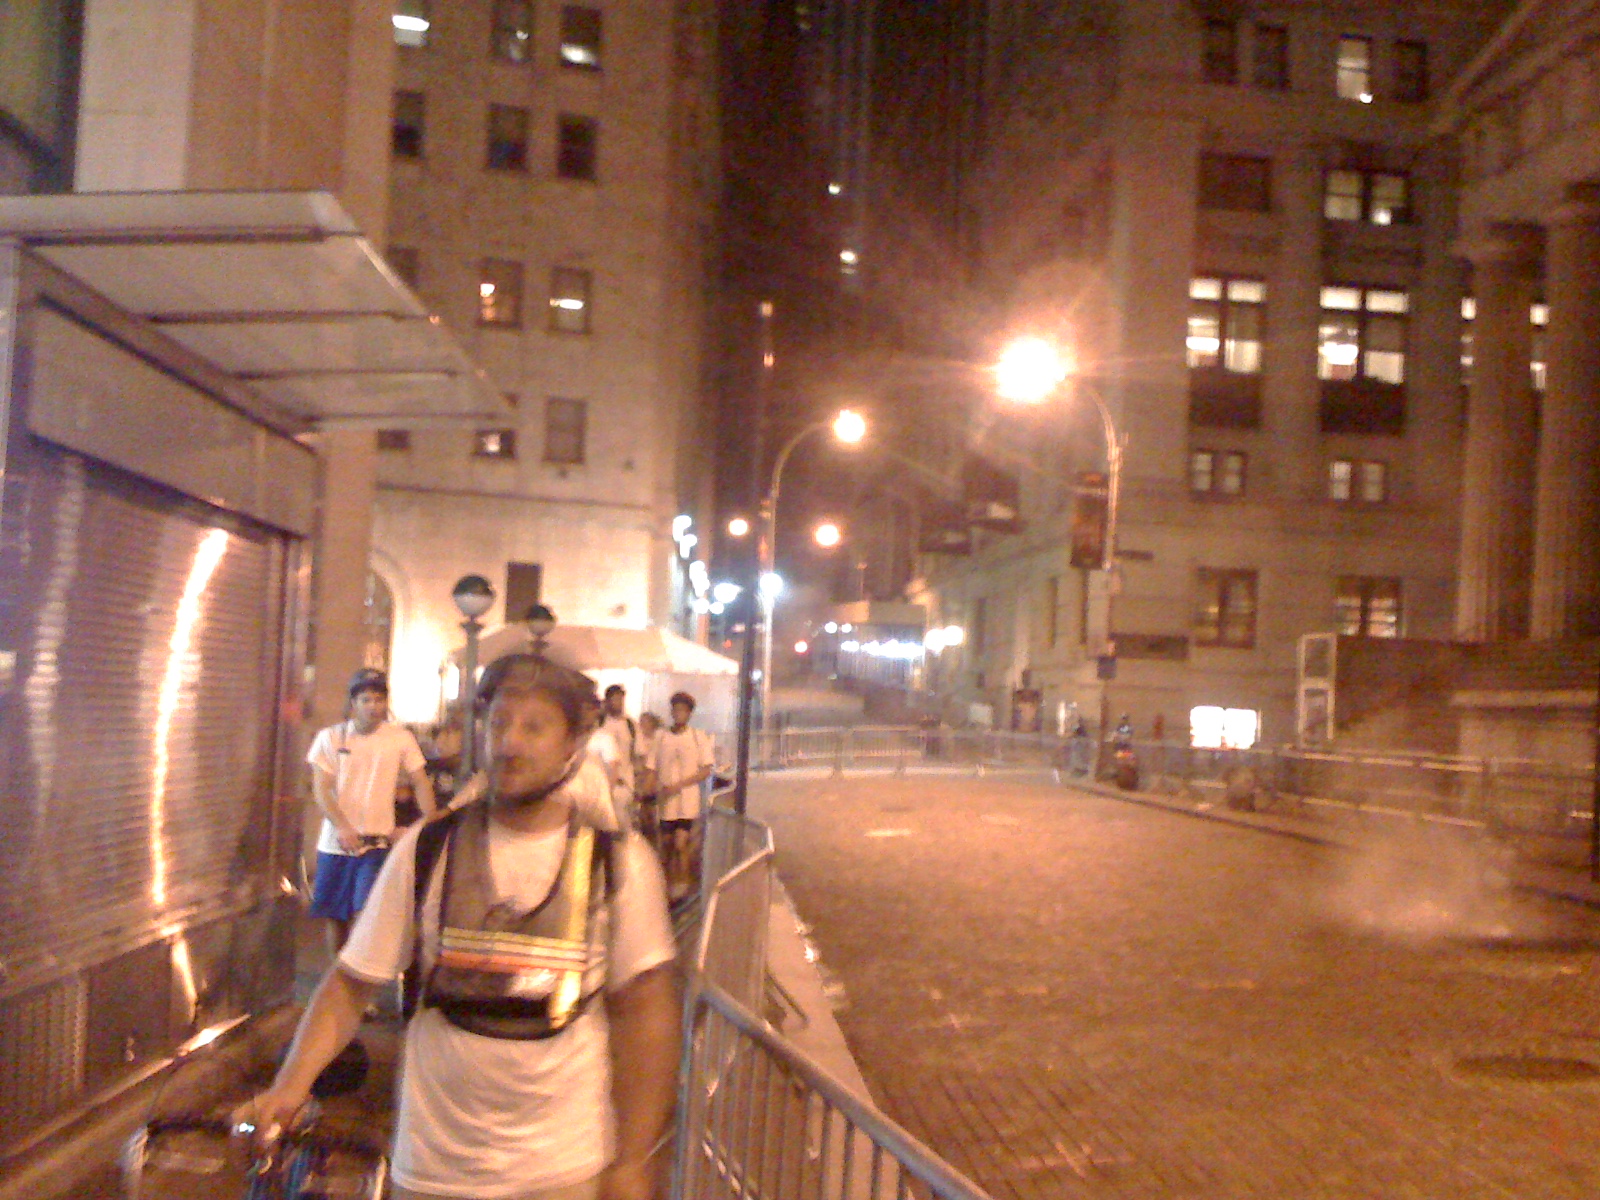
From there we went south, around Battery Park City and Battery Park. We were within a few blocks of the WTC site, and could see the incredibly over illuminated new Tower 1 going up. Another bunch (1/4 or the original group?) turned back around here, where the last subway stop for the 1 train (which Columbia is on) is.
Broad St & Wall St were pretty locked down (due to the OccupyWallStreet protests nearby), but we walked up and in front of the NYSE and Federal Hall.
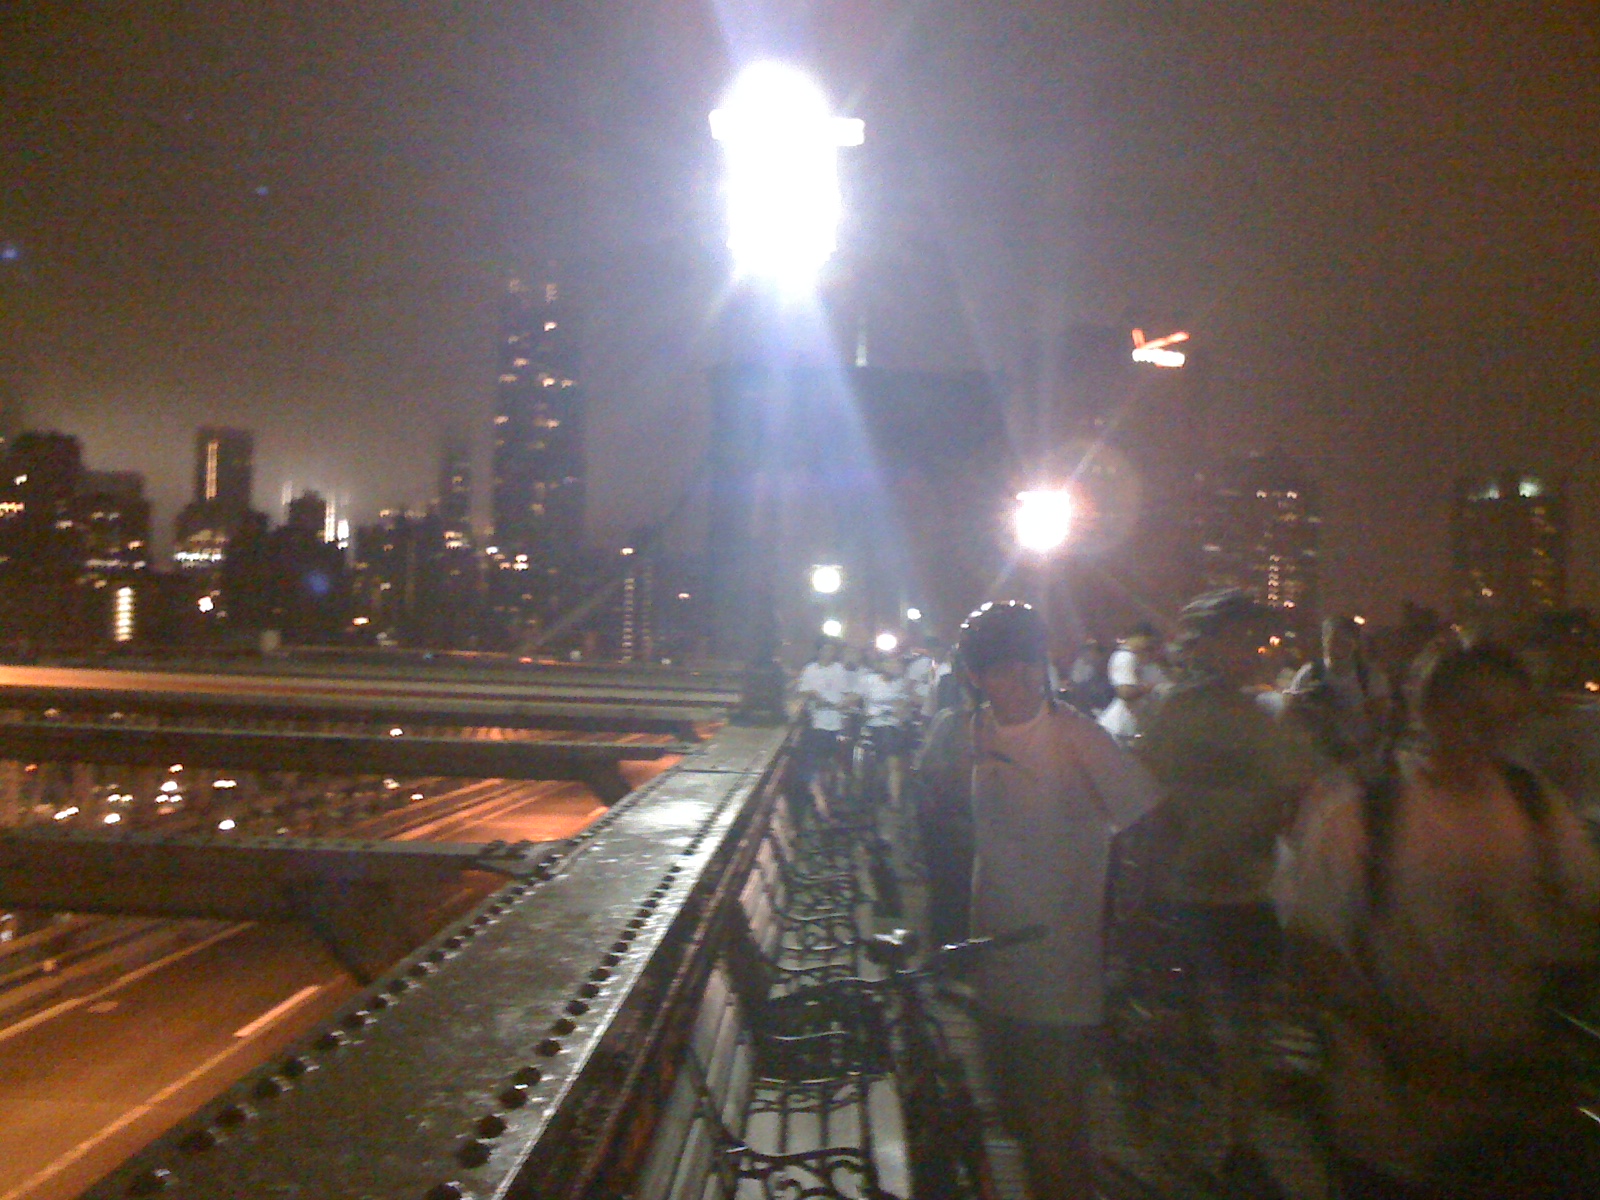
From there we went along to the Brooklyn bridge, went through brooklyn, and I ended up taking the Subway most of the way back (biking from 96th St -> 116th St because the transfer would have taken a long time).
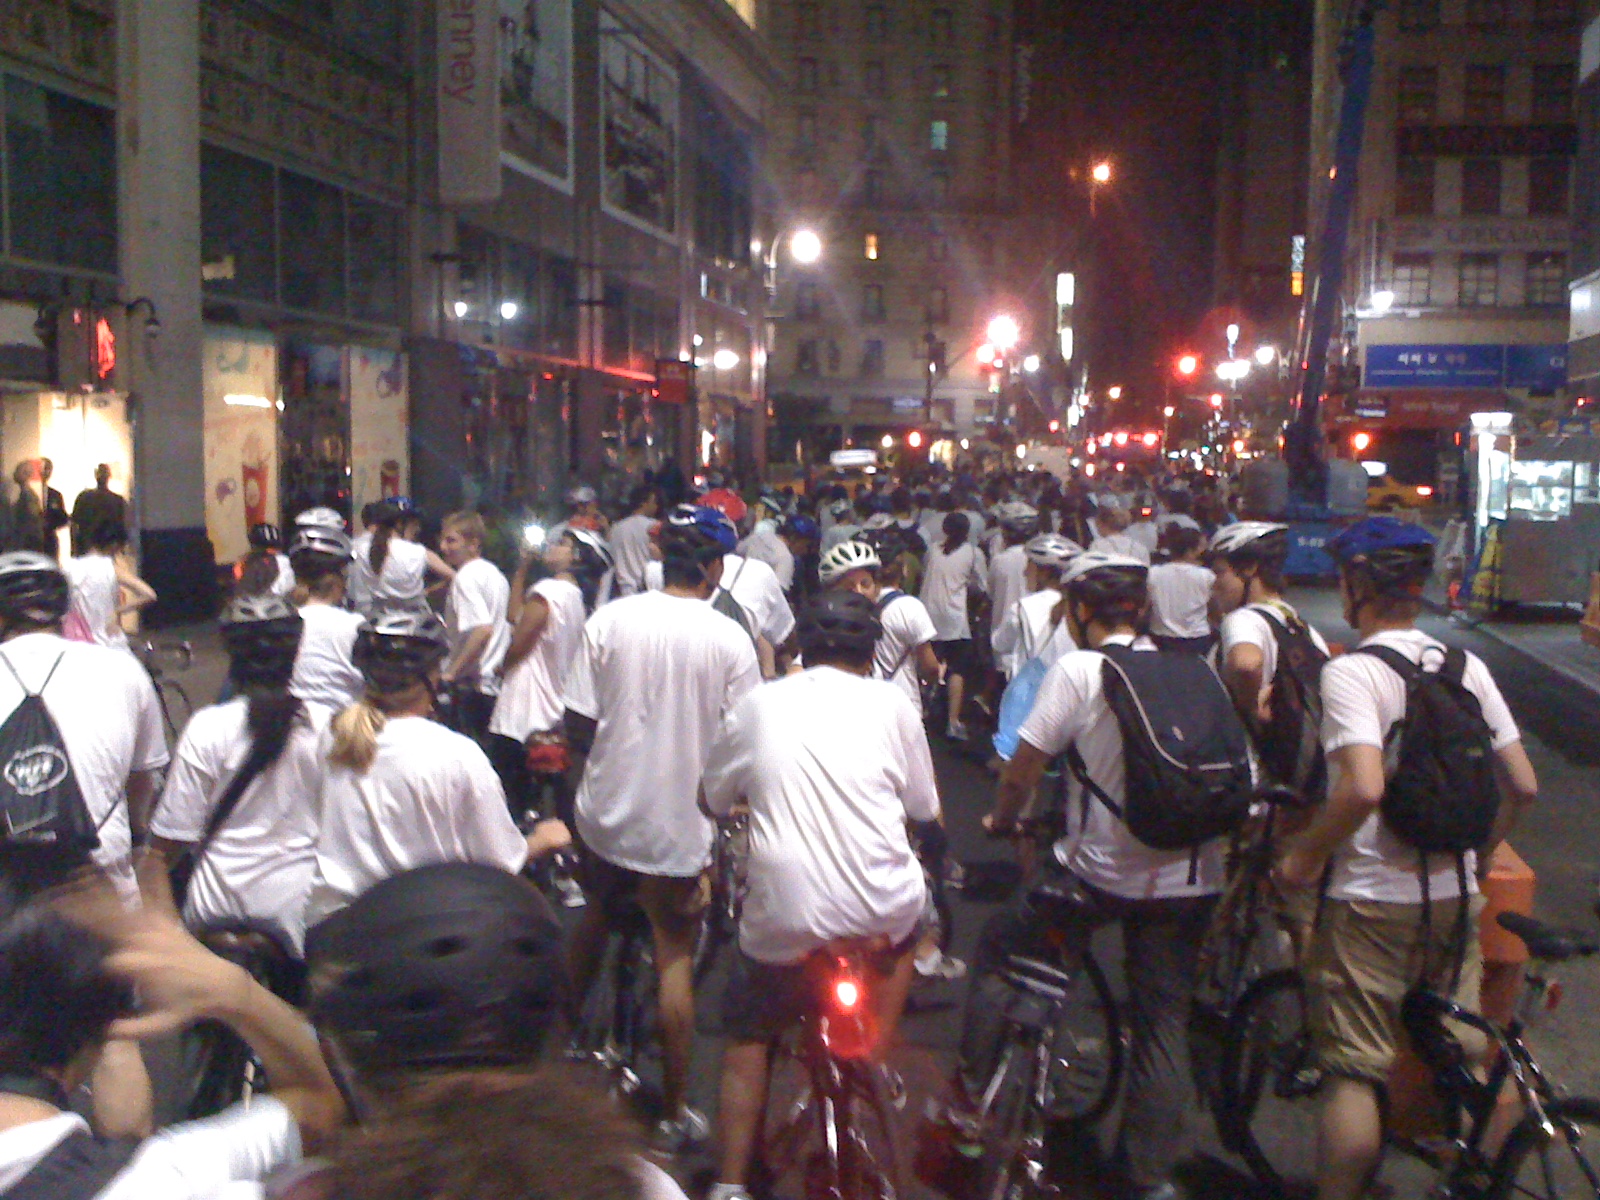
The experience was really cool. Especially the contrast between Central Park, time square, and the side streets. You’d go just 3 blocks and it would have a very different feel at 3AM. It was fun causing a little mayhem for taxis, especially since it was just minor. We regularly got honked at, and over a dozen volunteers would stand in front of the cross traffic, preventing them from even trying to go.
There was some school pride, which was fun (and not hugely common at CU). Seemingly nobody remembers the words to our fight song (because it’s stupid), although everyone knows “Roar, Lion, Roar.” A few people chanted it out, and the rest of us mumbled along.
| Roar, Lion, RoarAnd wake the echoes of the Hudson Valley!Fight on to victory evermore,While the sons of Knickerbocker rally roundColumbia! Columbia!
Shouting her name forever!
Roar, Lion, Roar
For Alma Mater on the Hudson Shore! |
From the Brooklyn Bridge on was a bit rough. We crossed around 4AM and were walking, rather than riding, a fair amount at that point. It also turns out it’s really hard to find a bathroom at ~5 in the morning, even in downtown Brooklyn.
1 Comment »
Posted: June 17th, 2011 | Author: chmullig | Filed under: School | Tags: Columbia, GS, school, study | 4 Comments »
Playing around today, I came upon an obvious/clever idea. A bit of hacking in Inkscape led to this. Note the crown, font and colors (don’t sue me, Trustees!)…

Keep Calm and Study On
For those interested I’ve uploaded PDF (if you want to print or have a larger copy or something) and SVG (if you want to modify) files. It’s in the original size/aspect ratio for the Keep Calm and Carry On posters, 19¾ x 29½. Anyone is welcome to use it – if you’re feeling generous you’re welcome to cite me.
4 Comments »


